|
4. Snowfall
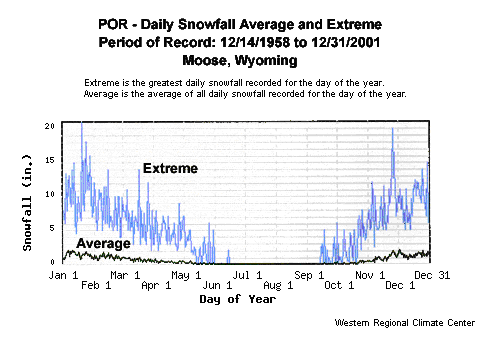
WRCC's graph, "POR Daily Snowfall Average and Extreme" (Figure 2) shows the extreme snowfall values plotted for the entire 43-year period. When WRCC "Period of Record Daily Climate Summary" is analyzed for snowfall extremes, every calendar year is represented in the extreme snowfall graph plot in Figure 2.
For example, in the winter of 1964/65 (November through April), eleven of those extreme values occur. They are as follows:
| Date |
Extreme Recorded
Daily Snowfall |
| 11 |
DEC |
1964 |
15 cm |
(+ / - 6") |
| 15 |
DEC |
1964 |
15 cm |
(+ / - 6") |
| 27 |
DEC |
1964 |
23 cm |
(+ / - 9") |
| 6 |
JAN |
1965 |
30.5 cm |
(+ / - 12") |
| 7 |
JAN |
1965 |
33 cm |
(+ / - 13") |
| 24 |
JAN |
1965 |
46 cm |
(+ / - 18") |
| 27 |
JAN |
1965 |
28 cm |
(+ / - 11") |
| 27 |
JAN |
1965 |
25.4 cm |
(+ / - 10") |
| 27 |
FEB |
1965 |
10 cm |
(+ / - 4") |
| 26 |
MAR |
1965 |
30.5 cm |
(+ / - 12") |
| 27 |
MAR |
1965 |
15 cm |
(+ / - 6") |
Presumably, additional snow fell during this 1964/65 winter but was not summarized because the daily snowfall was not an extreme. What this extreme snowfall indicates is that multiple extreme snowfall events occur and are spread out over the entire winter season. Furthermore, between 24 29 Jan 1965 at least 99 cm (+/- 39") of snowfall occurred within this six-day period. This 99 cm (+/- 39") snowfall was on top of the 63.5 cm (+/- 25") snowfall that had occurred a little over two weeks prior on 6 and 7 January 1965. This is potentially at least 162.5 cm (+/- 64") of snow accumulation over about three weeks.
Assuming the WRCC "Average Snowfall" had occurred each day between 7 January 1965 and 24 January 1965, another 60 cm (+/- 24") probably occurred. The total potential snowfall of 223 cm (+/- 88") occurred over a three-week timeframe.
This amount of snowfall at an initial density of 10% water content represents over half of the roof design snow load. One can easily deduce that over an entire winter season, the roof design snow load could be readily exceeded, even empirically factoring in normal roof snow-reducing measures such as wind stripping, sliding and meltwater runoff. In addition, blowing wind also compacts and densifies the remaining drift snow, reducing snowdrift volume but not weight.
SNOW DISTRIBUTION ON THE CASE STUDY ROOF
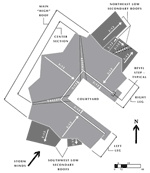
1. Main "High" Roof (Figure 3)
As previously described, the main shed roof is U-shaped and each side slopes down toward the center courtyard. The left (southwest) leg slopes northeast, and is on the lee side of the storm winds. It is also in the shade of the afternoon winter sun. The center (northwest) section of the U-shaped main roof slopes southeast. The left portion is partially in the lee while the right portion is partially to windward. It also is fully exposed to midday winter sun. The right (northeast) leg slopes southwest and is on the windward side of storm winds. This right leg receives full afternoon sun. The outer, high edge of the shed is an architecturally random sawtooth design, but the roof is still a flat plane sloping at 3:12 toward the courtyard. When the slope reaches the covered walkway, a bevel step slopes down about 23 cm (9") and continues at a 3:12 slope to the straight-line eave bordering the courtyard.
|