|
DESIGN CASE STUDY BACKGROUND
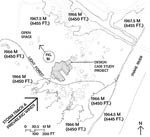
The design case study project is a one-story recreational assembly building with ancillary office and retail space located in Moose, Wyoming, USA. Its size is approximately 2322 M2 (25,000 sf) and is located on nominally flat terrain, lightly forested at elevation 1966 M (6450 ft.)(Figure 1A).
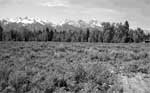
The building is approximately 5 km (3 mi.) east of the foot of mountains rising to above 3960 M (13,000 ft.)(Figure 1B).
The designed building is "U"-shaped, surround-ing a large courtyard. The main "high" roof is a metal covered "cold3" shed roof that is sloping at a 3:12 pitch toward the courtyard. The pitch bevel steps down and continues at 3:12 over the last +/- 4.8 M (16 ft.) covered walkway surrounding the perimeter of the courtyard. Secondary "low" roofs are also "cold" shed roofs abutting walls and slope at 2:12 pitch toward the outer perimeter of the building. These secondary roofs cover only spaces projecting from the main "U" plan form. The sloping roof design snow load used by the design team was 4.93 kN/m2 (101 lb/ft2). The ground snow load is 7.81 kN/m2 (160 lb/ft2).
LONG-TERM WEATHER ANALYSIS
1. Storm and Prevailing Wind Direction
Based upon local weather data and discussions with local Moose, Wyoming residents, the winter storm direction as well as wind direction is from the southwest. According to local residents, storm wind has a major influence on the snow distribution in the area. Blowing snow over unobstructed stretches of terrain causes very large snowdrifts when even short-to-medium height obstructions or terrain changes occur. Road closures are common as is the overnight burial of tractor/trailer trucks. Snowdrifts are a big problem.
2. Long-Term Data
Western Regional Climate Center1 (WRCC) website data for Moose, Wyoming was only available for 43 years (1958 2001).
3. Temperature
Analysis of WRCC "Monthly Average Temperatures" during winter over the 43 years was made to determine how cold on average it was at the site. All temperatures above 6° C (+22° F) were eliminated based on the need for the cold roof to function properly (Tobiasson, Buska2). Their studies con-firmed that when ambient outdoor air temperature is above 6° C (+22° F), building heat loss usually warms the cold roof flowing air to above freezing, causing roof snow to melt. The meltwater refreezes at eaves, causing icicles/ice dams.
Analysis indicated that in November, 25% of the time the average monthly temperature was below -6°C (+22° F). This increased, as expected, to 100% of the time in December and January and 85% in February. In March it dropped off to 15% and fell to 0% in April. This indicates that on average, it gets below freezing in late November and remains that way through February and into March of the following year. In March, the sun angle begins to have an effect. Sun angle during December and January is not a big factor at this site.
In general a "cold roof" should function well and the roof snow will generally not be subject to melting between late November and mid-March. WRCC "Period of Record Daily Climate Summary" data shows maximum temperatures on a day-by-day basis and the years they occurred. These recordings indicate that during the winter months, highs in the range of 6° C to 13° C (+/-43° F to +/-55° F) occur. These extreme highs are significantly above freezing and have occurred in approximately half of the 43-year data span. Furthermore, the data shows record
snowfall highs for dates within a few days prior to the record temperatures. It therefore can be concluded that periods of roof snow melting and refreezing will happen multiple times during the winter months in most years. Roof snow consolidation from both melting and slippage will have to be taken into account.
|