| |
||||||||
| The cabin is located
at 2146m (7040ft) elevation on the west side of the crest of the range.
The area experiences heavy snowfalls at an average of 6m (204 inches)
ground snow per winter. (Figure 7) On an average of 96 days per year the
minimum temperature drops below freezing. During the monitored time period,
November 1998 – April 1999 and November 1999 to January 2000, the
lowest temperature measured was –19°C (-2°F). The time with
the critical temperature of -5.6°C (22°F) or less for the formation
of icing expands over 766 hours. This represents 17% of these six months.
The Sugar Bowl Cabin is covered with a cold roof. A closed cell polyurethane
insulation with a U-value of 0.026 (R38) is built in.
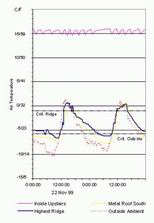
The ventilated air space between the insulation level and the roof shell is 152 m (6 inches) wide. The air intake is at the eaves, the air outlet through the metal ridge cap to the vent shafts, which extend above the snow cover on the roof. (Figure 3) This cold roof air space is equipped with sensors in various locations, which read the temperatures every 15 minutes 24 hours a day. Two of these sensors are located within the ridge cap of the roof, four in the air space at the eaves of the roof, and one sensor reads the temperature of the South facing metal roofing. Additional sensors take temperature readings of the outside ambient temperature, interior upstairs temperature and interior downstairs temperature. The data obtained shows temperature readings in typical cold weather situations (Figures 8+9). December 5 and 6, 1998 are two days within a cold weather period with temperatures mostly under -5.6°C (22°F), in which Sugar Bowl roofs are prone to icing. Ridge and metal roof temperatures are very close. This indicates snow cover on the roof. Sensor readings show ridge temperatures mostly between -6°C and –4°C (25°F and 28°F). No icing develops on the roof at these cold roof air space temperatures. Figure 10 shows temperature readings for November 1998 to April 1999, Figure 11 provides the same information for November 1999 to January 2000. The principles of a cold roof to work are perceived in a lower temperature at the eaves and a generally higher temperature at the ridge. Cold air enters at the eave and heats up as it passes the warm inner roof. As warm air is lighter than cold air, it rises to the ridge where it is vented. For that reason this analysis uses the highest temperature at the ridge as worst-case scenario to determine the time period when icing at eaves occurs. Ridge temperature readings exceed -1.1°C (30°F) in 51 readings which equals a total time of 12.75 hours in the winter 98/99. The longest consecutive time period of ridge temperatures above -1.1°C (30°F) is 1 hr 45 min or three cumulative hours within a seven hour time period. The times with high ridge temperatures usually range between one hour and 1½ hours per day. Icicle and ice dam formation at this cabin possibly occurred at 1.7% of the time with temperatures below -5.6°C (22°F) or at a total of 0.07% during the whole 6 months winter period. Climate conditions increase the formation of icing in Sugar Bowl. Unlike upstate New York where temperatures remain under freezing for extended time periods and snow melting is only caused by interior heat loss, temperatures in Sugar Bowl rise above freezing most days of the winter. Snow melts during the day and the melt water runs down the slope under the snow blanket to the eaves and there refreezes at night. Figure 12 shows a temperature chart for a typical day of this thaw and freeze cycle, which naturally creates more ice dams than conditions in New York.
|
||
| |
||||||||
Roof Design in Regions of Snow and Cold
by Ian Mackinlay, FAIA; Richard S. Flood,
AIA/CSI and Anke Heidrich
Hjorth-Hansen, Holand, Løset & Norem (eds.) © 2000 Balkema,
Rotterdam. Proceedings of the Fourth International Conference on Snow Engineering,
Trondheim, Norway; 19-21 June 2000. Rotterdam: Balkema: 213-224. ISBN 90 5809
Photographs are by Ian Mackinlay except as noted.
 |
||||||
| Figure 7 | ||||||
 |
||||||
| Figure 9 | ||||||
 |
||||||
| Figure 8 | ||||||